Getting Started
How to Use the OutreachBox Dashboard to Track Your Marketing
Updated June 15, 2026
Quick answer: The OutreachBox dashboard is your command center. It shows live stats for your influencer, SEO, and sales campaigns, your AI agents, campaign and weekly-activity charts, contact status, and a built-in todo list and notes — so you can see what's working and jump to any feature in one click.
When you log in, the dashboard loads automatically. It's designed to answer one question at a glance: what should I focus on today? Here's how to read it and use it.
What the dashboard shows
- Statistics cards — active and total counts for Influencer Campaigns, SEO Campaigns, Sales Campaigns, and AI Agents. Each card is clickable and takes you to that section.
- Campaign performance chart — a bar chart comparing average prospects found by search type.
- Weekly activity chart — a line chart of prospects found and campaigns created over the last 7 days.
- Contact status updates — distribution of your contacts, prospects, and influencers (active, unsubscribed, bounced, etc.).
- Todo list — create and check off daily tasks.
- Notes — jot quick reminders.
- Recent activity — a timeline of recent campaigns and agents with status indicators.
How to use the dashboard day to day
- Scan the statistics cards to see active campaigns and agents at a glance.
- Check the weekly activity chart to confirm prospecting and campaign creation are trending in the right direction.
- Review contact status to catch rising bounce or unsubscribe rates early.
- Click any card to jump straight to that feature's detail view.
- Add todos and notes to keep your daily plan in one place.
Understanding the charts and colors
- Bar charts compare categories; line charts show trends over time.
- Color coding: green = completed/successful, yellow = active/in progress, red = failed/issue, blue = planning/draft.
- Hover over any chart segment for exact numbers.
Best practices
- Check the dashboard daily — it surfaces problems (errors, bounces) before they grow.
- Use the todo widget for time-sensitive follow-ups.
- Treat a spike in red statuses as a prompt to open the affected campaign or agent.
Frequently Asked Questions
Why is my dashboard showing "No data"?
You haven't created any campaigns, agents, or contacts yet, or there's no activity in the selected window. Create your first project or campaign and data will appear as you use the platform.How often does the dashboard update?
It uses a cache-first strategy for fast loading, fetches fresh data in the background, and updates some metrics in real time. Refresh the page to force the latest data.Can I customize the dashboard layout?
The layout is currently standardized. Customizable widgets and date ranges are planned for future updates.Related articles
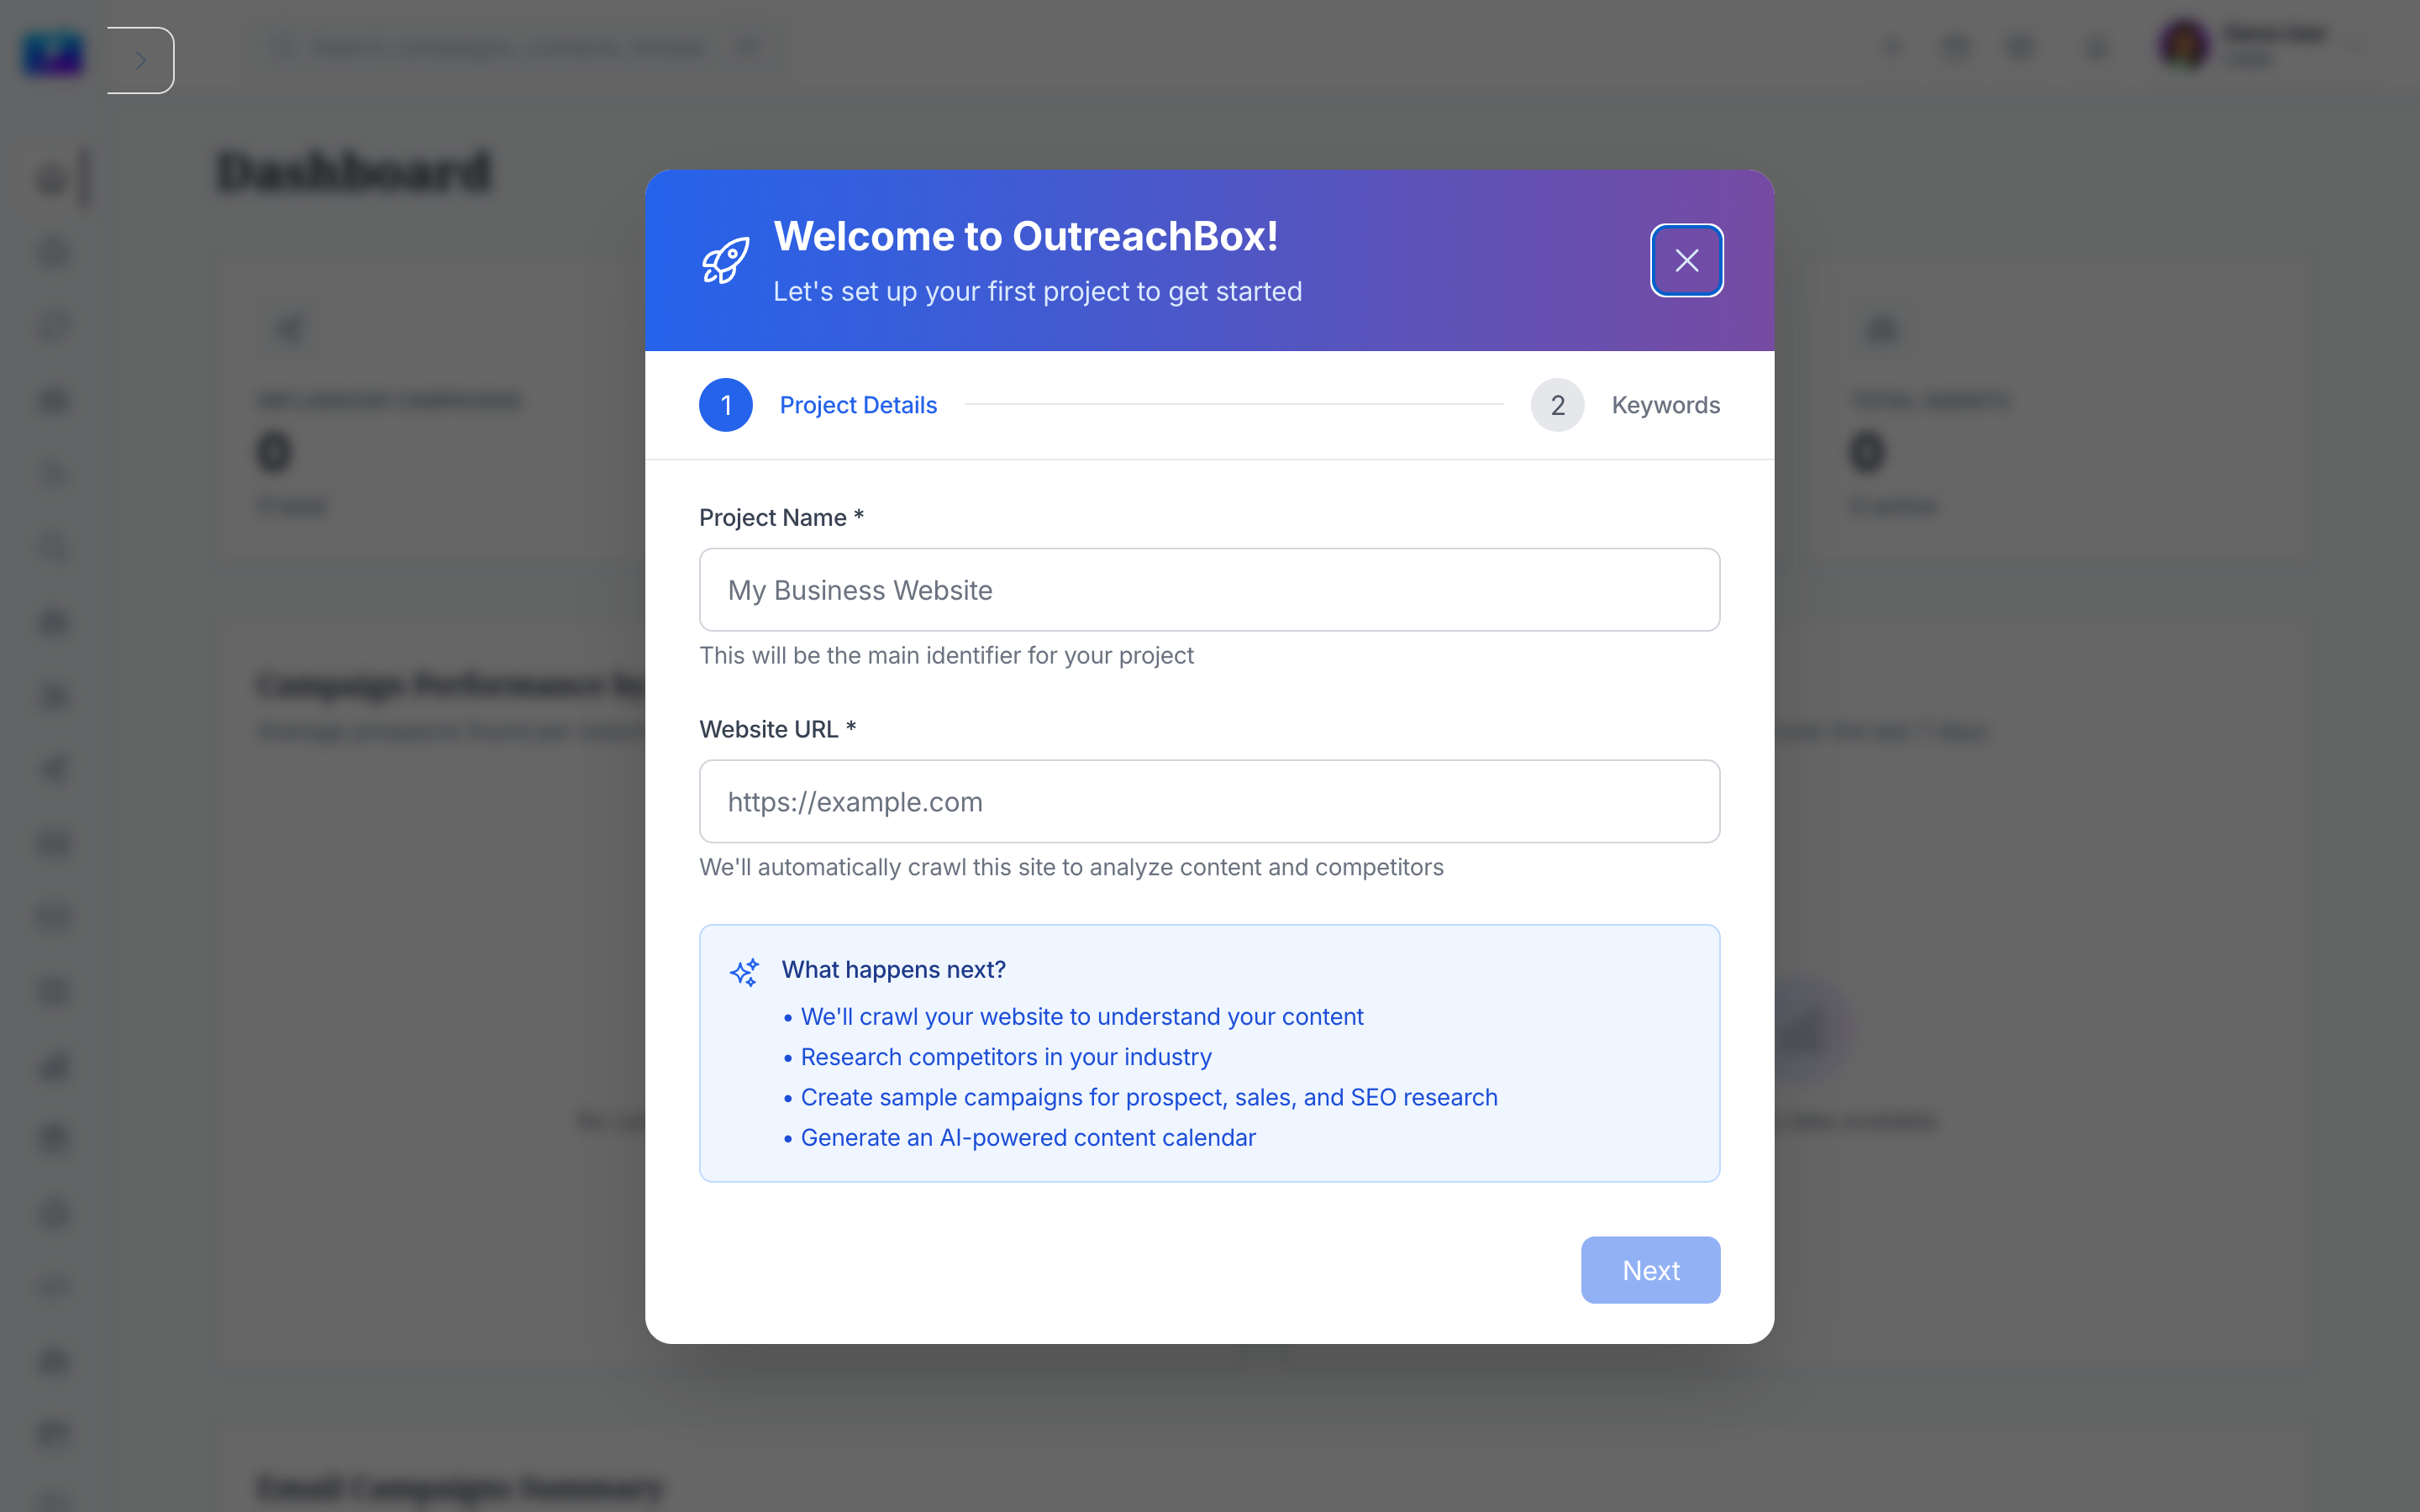
- How to Create an OutreachBox Account and Get Started
- How to Use the Analytics Dashboard
- What Are AI Agents and How to Use Them
Use the dashboard as your daily starting point — it tells you what's working and where to act next.
Need more help?
Browse our knowledge base for more guides and tutorials